Area-Value Map CSV File
neoEBV can display a colormap by loading a CSV file describing sets of an area and a value in the following format.
Area-Value Map CSV File has a header line at the beginning and then map elements follow thereafter. One element is described in one line.
Header Line
The header line should have at least 5 columns and the first 4 columns should be one of the followings.
sx,sy,ex,ey, ...
x1,y1,x2,y2, ...
xmin,ymin,xmax,ymax, ...
llx,lly,urx,ury, ...
lbx,lby,rtx,rty, ...
Specify the Element
An element consists of one area and one value.
The area is specified by the lower left coordinates <sx>, <sy> and the upper right coordinates <ex>, <ey> separated by comma. Values are treated as [um].
Subsequently, specify a value <value> separated by comma. The 6th column and beyond are ignored.
<sx>,<sy>,<ex>,<ey>,<value>
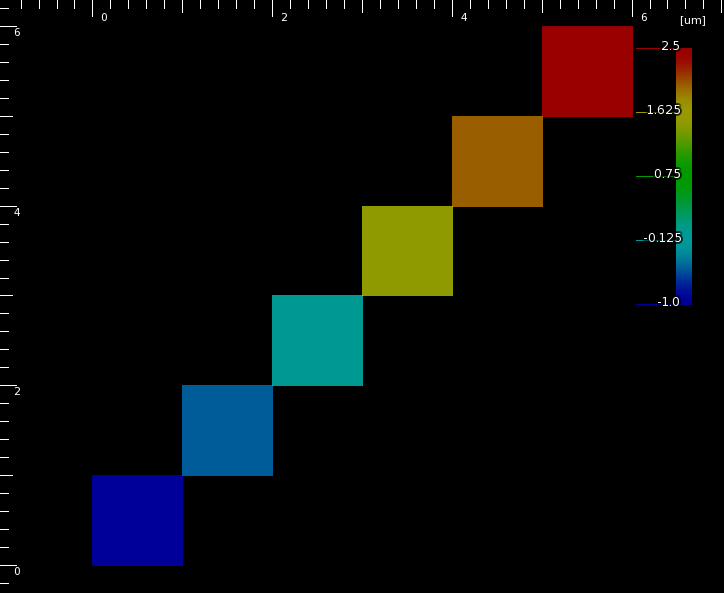
Area-Value Map CSV File Sample
sx,sy,ex,ey,value
0,0,1,1,-1.0
1,1,2,2,-0.5
2,2,3,3,0.0
3,3,4,4,1.5
4,4,5,5,2.0
5,5,6,6,2.5
Display Method
The following command displays a colormap from Area-Value Map CSV. You can change your settings here Settings(Area-Value Map CSV)
$ nebv /path/to/area_value_map_csv
Display Example
The above sample file is displayed as follows by the following command.
$ nebv /path/to/sample.csv --area-value-map-csv-range=-1,2.5