Density Map File
The file describing the ratio of total figure area to mesh cell area for each mesh-divided area.
Do one of the following to open Density Map dialog:
Calculate/Density Map from the context menu that appears when screen is pressed with right-click or right-drag.Density Map.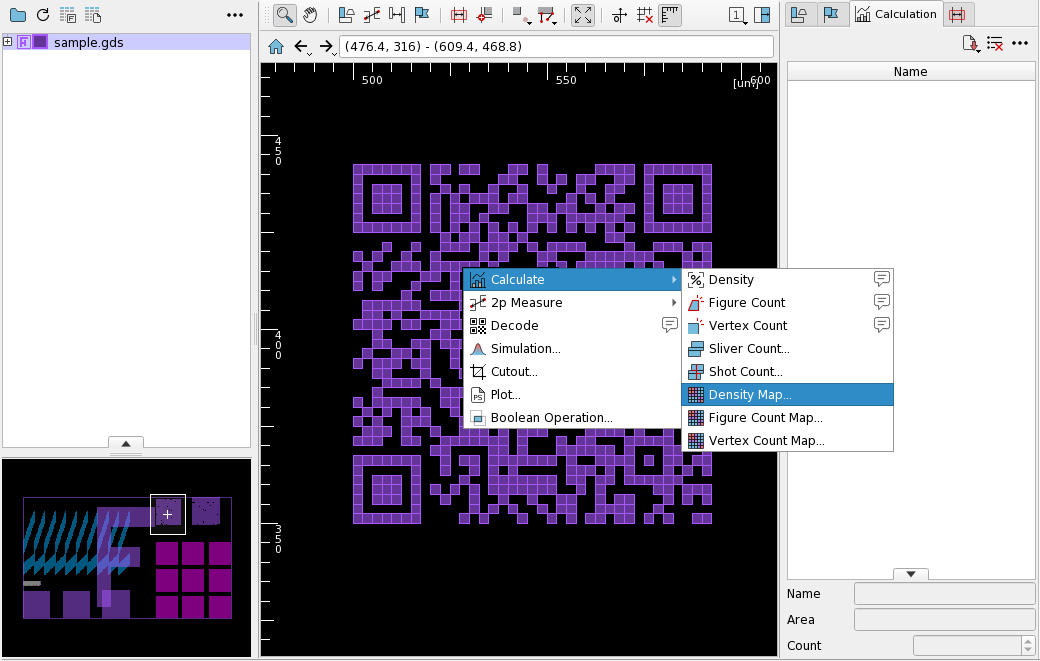
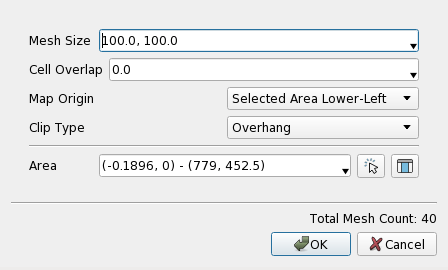
| Item | Action |
|---|---|
| Mesh Size | Specify the mesh size. |
| Mesh Overlap Size | Specify the overlap size of the mesh. |
| Mesh Origin | Specify the mesh origin. |
| Clip Method | Specify how to place the topmost row and rightmost column of the mesh when the specified area is not a multiple of the mesh size. |
| Area | Specify the calculation area. |
A preview of the specified area and the resulting mesh grid is shown on screen, and is updated as you change the parameters.
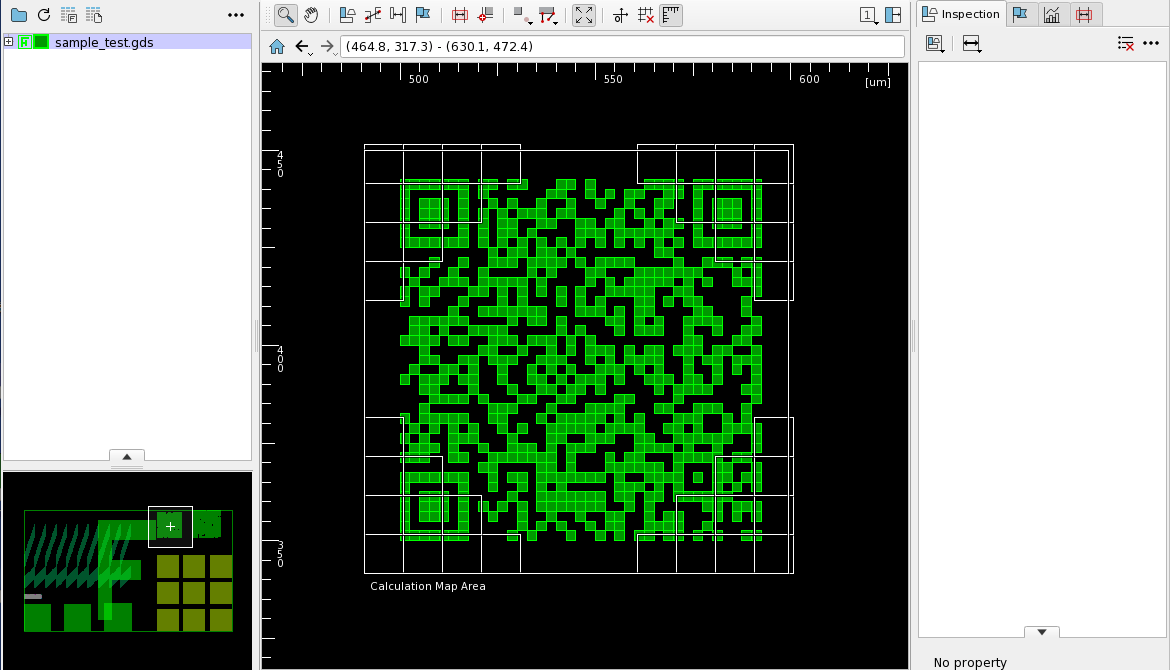
Specify the calculation area in Area and press OK to begin calculation.
The calculation result is saved to Calculation Panel datalist and displayed on screen.
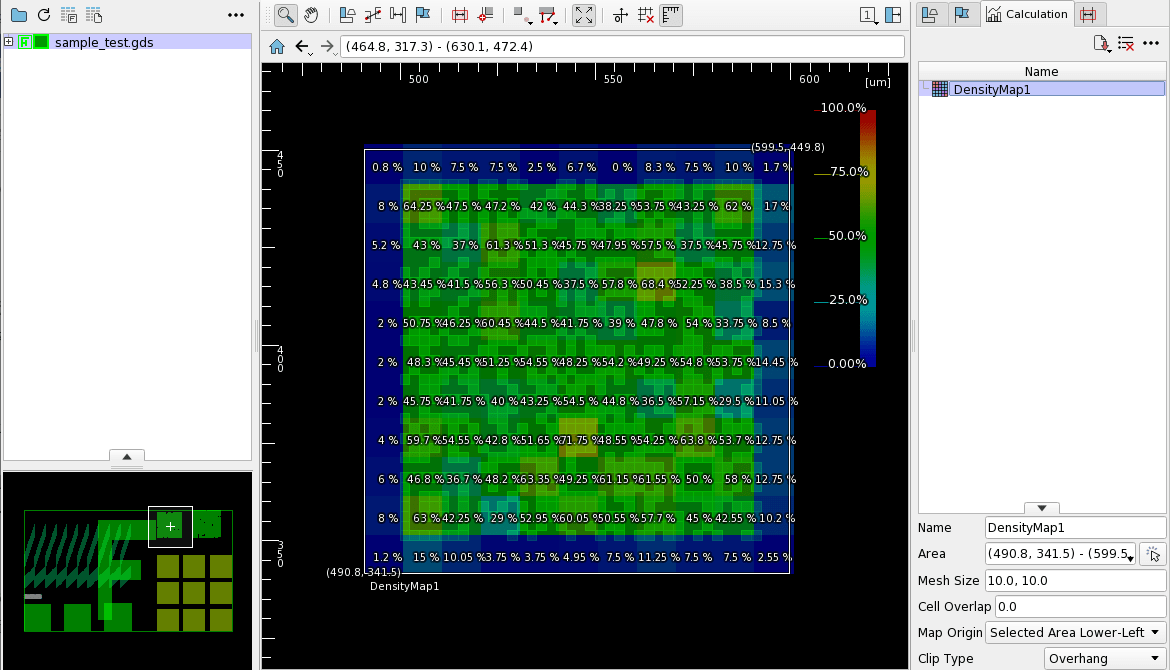
Right-click on the calculation result displayed on screen or in the datalist to open the context menu, containing the following items in addition to the default context menu items.
| Item | Action |
|---|---|
| Show | Show/hide the calculation result on screen. |
| Display/Highlight | Toggle the highlight of the calculation result colormap on screen. |
| Display/Name | Show/hide the name of the calculation result on screen. |
| Display/Coordinates | Show/hide the coordinates of the calculation result on screen. |
| Display/Cell Info | Show/hide the borders of each mesh of the calculation result on screen. You may need to zoom in to see the borders. |
| Display/Cell Value | Show/hide the value of each mesh of the calculation result on screen. You may need to zoom in to see the values. |
| Color | Change the display color of the calculation result on screen. |
| Style/Outline | Show/hide the outline of the colormap of the calculation result on screen. |
Select Load AreaFile/Density Map from the main menu to open Open AreaFile for Density Map dialog.

Select an Area File and press OK. The calculation is performed on each area described in the file.
Refer to Area File page.
The calculated results can be saved to a text file in CSV format.
Click the  icon on Calculation Panel and select
 Density Map to open the Save Density Map dialog.
Specify the file name and press OK to save the results. The output has the following format:
#Density Created by nebv VERSION (uid=UID) USER@HOSTNAME DATE
#COMMAND addDensityMap
#ARGS AREA="490.8,341.5,530.8,351.5"
#ARGS MESH_SIZE="10,10"
#ARGS OVERLAP_SIZE=0
#ARGS ORIGIN="Selected Area Lower-Left"
#ARGS CLIP_METHOD=Overhang
#xmin,ymin,xmax,ymax,rate,dimension[um^2]
490.8,341.5,500.8,351.5,0.012000,1.200000
500.8,341.5,510.8,351.5,0.150000,15.000000
510.8,341.5,520.8,351.5,0.100500,10.050000
520.8,341.5,530.8,351.5,0.037500,3.750000
530.8,341.5,540.8,351.5,0.037500,3.750000
            :
            :
Specify --density-map-file option with an Area File at startup to execute calculation on each area described in the file after startup.
You can also specify the filename to save the calculation results using --density-map-file-out option.
By specifying as follows, the calculation results for the specified range in figure_file will be output to density_map_file.txt:
$ nebv --density-map-file=/path/to/areafile.txt --density-map-file-out=/path/to/density_map_file.txt /path/to/figure_file
$ nebv --density-map-file="0,0,100,100" --density-map-file-out=/path/to/density_map_file.txt /path/to/figure_file
For Area File syntax, Refer to Area File page.
See --density-map-file, --density-map-file-out in Boot Options page.
The calculation method and display method of Density Map can be changed from Preference. See preference Action/Density Map page for detail.
The file describing the ratio of total figure area to mesh cell area for each mesh-divided area.